Choose timezone
Your profile timezone:
Commissioning at P2
Physics
Framework
Otherwise mainly busy writing, correcting, rerunning
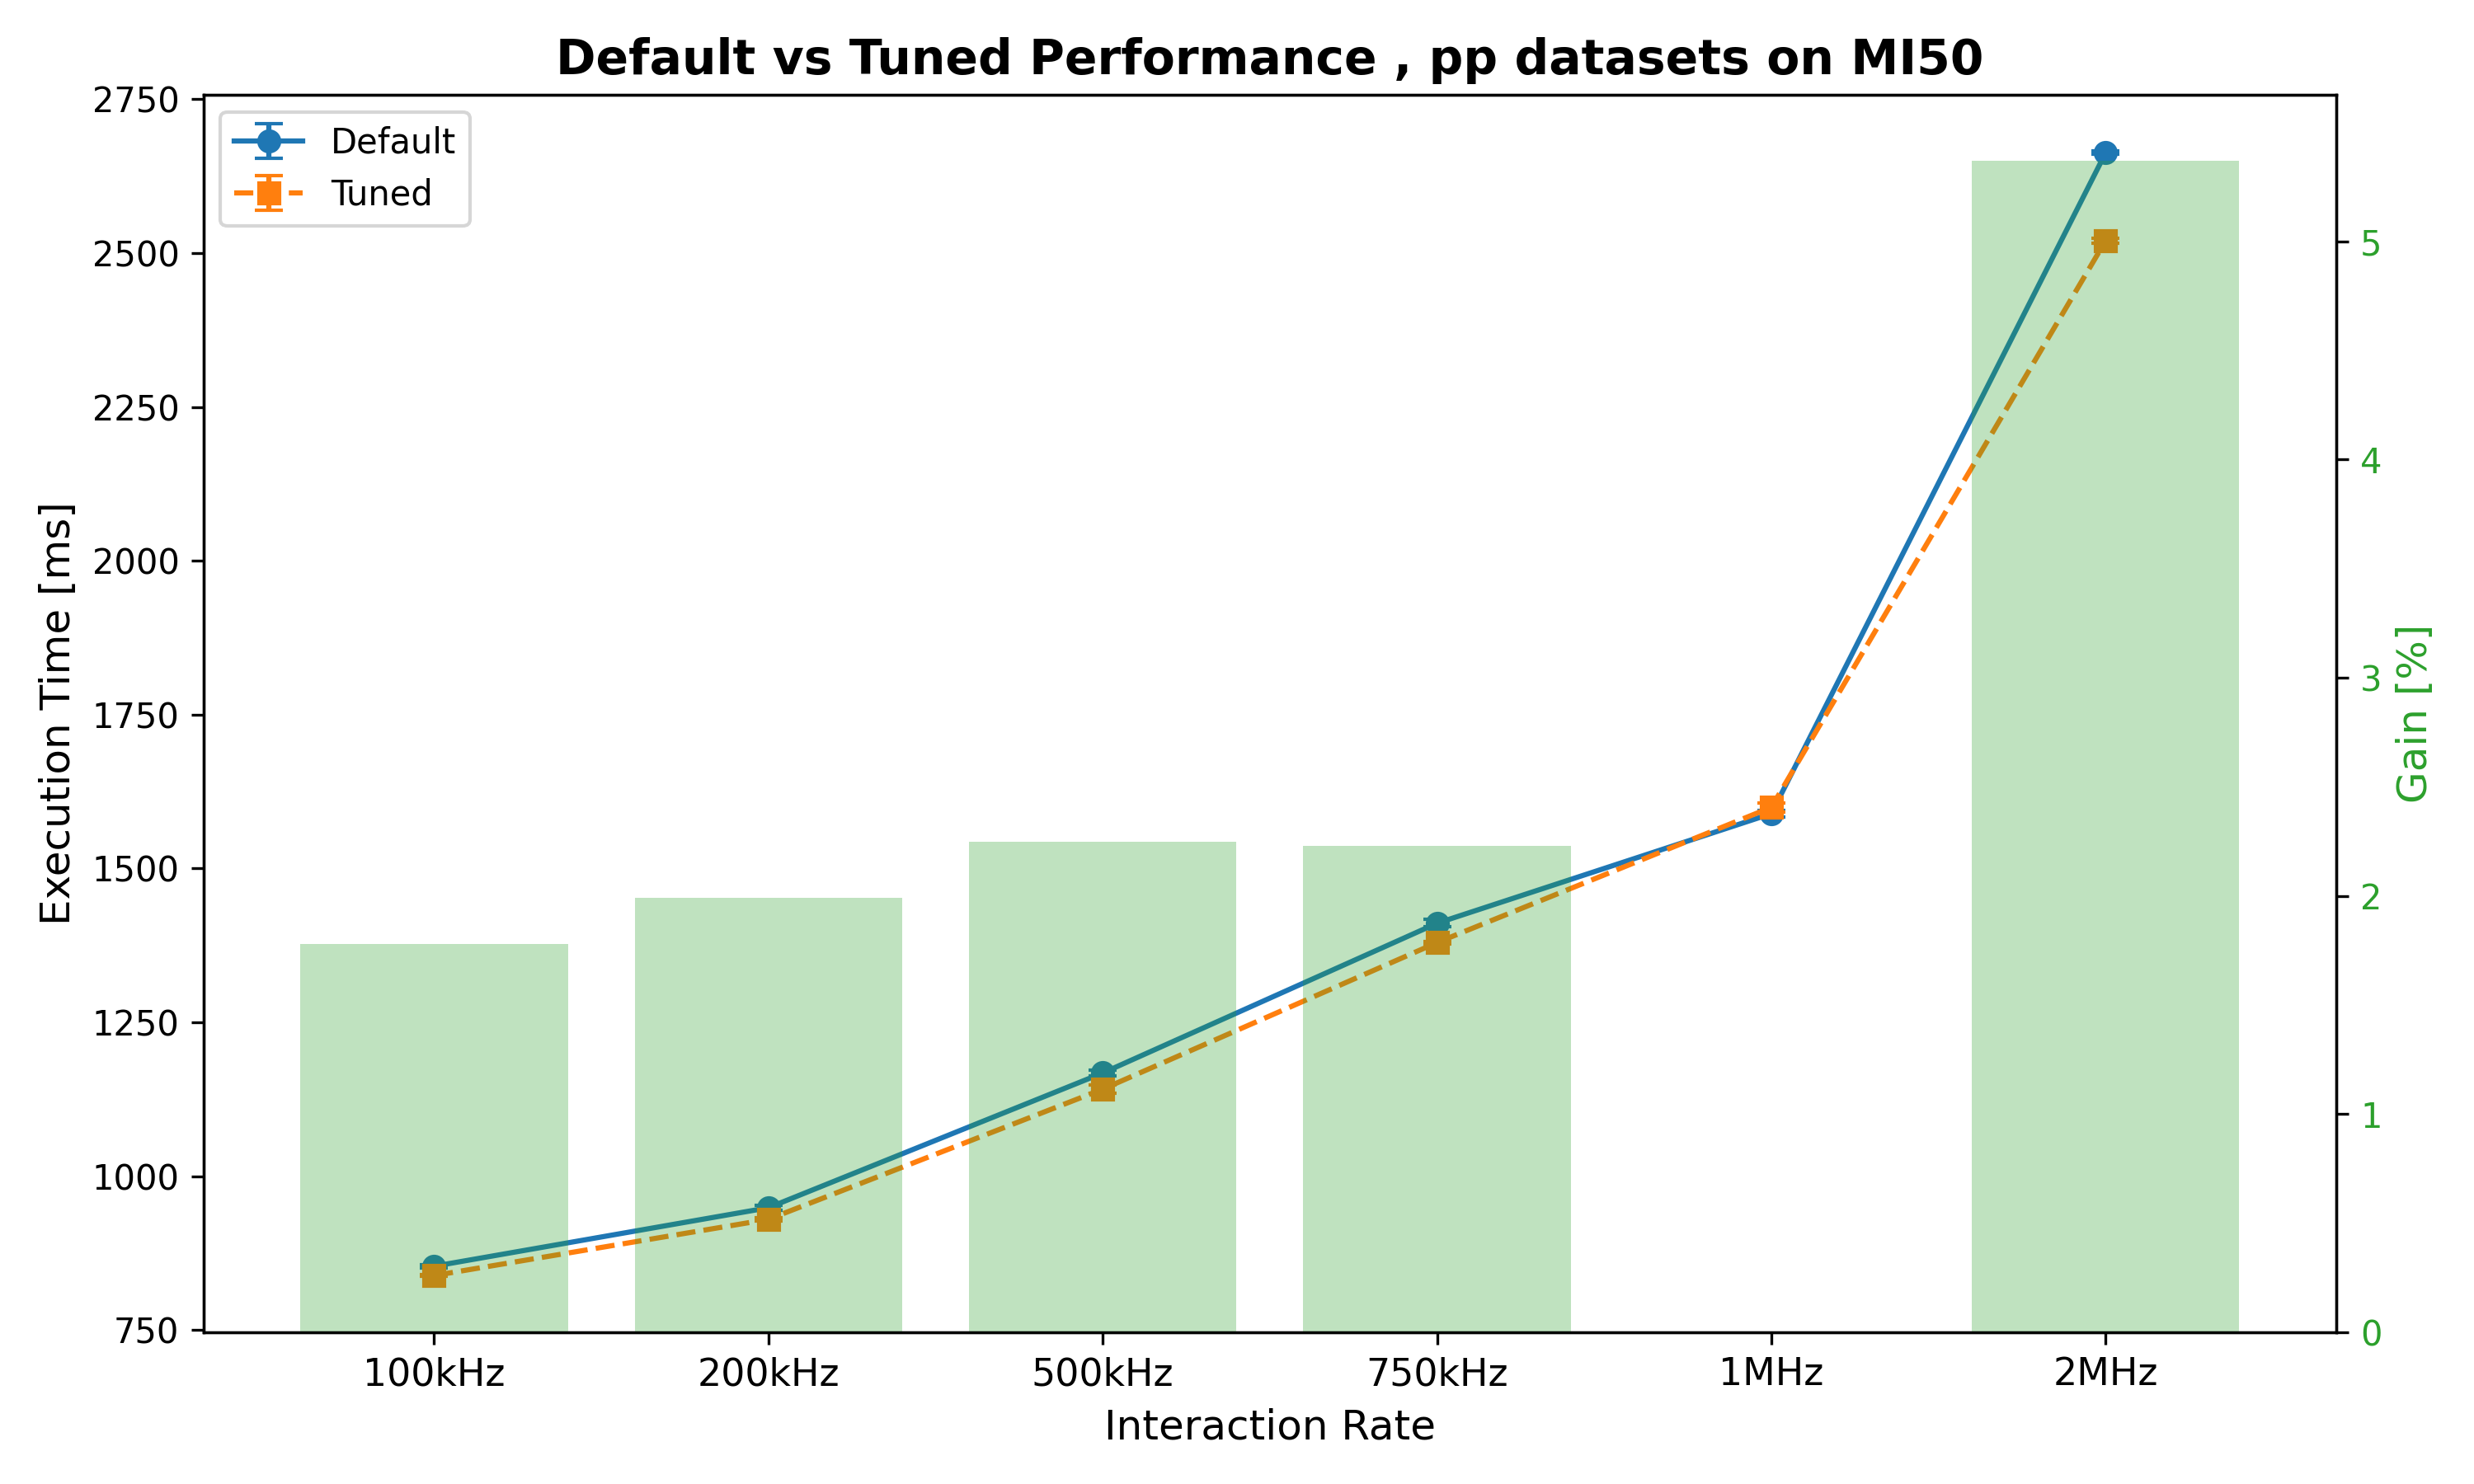
Tested best parameters for PbPb 50 kHz with other IR and beam types:
| Interaction Rate | Default mean time [ms] | Tuned time [ms] | Gain |
| 100kHz | 853.65 ms ± 2.79 ms | 838.47 ms ± 1.02 ms | 1.78% |
| 200kHz | 948.67 ms ± 4.06 ms | 929.81 ms ± 2.52 ms | 1.99% |
| 500kHz | 1167.65 ms ± 4.66 ms | 1141.34 ms ± 6.77 ms | 2.25% |
| 750kHz | 1411.01 ms ± 5.84 ms | 1379.58 ms ± 2.33 ms | 2.23% |
| 1MHz | 1589.10 ms ± 5.01 ms | 1599.41 ms ± 7.31 ms | -0.65% |
| 2MHz | 2663.11 ms ± 2.79 ms | 2520.22 ms ± 4.48 ms | 5.37% |
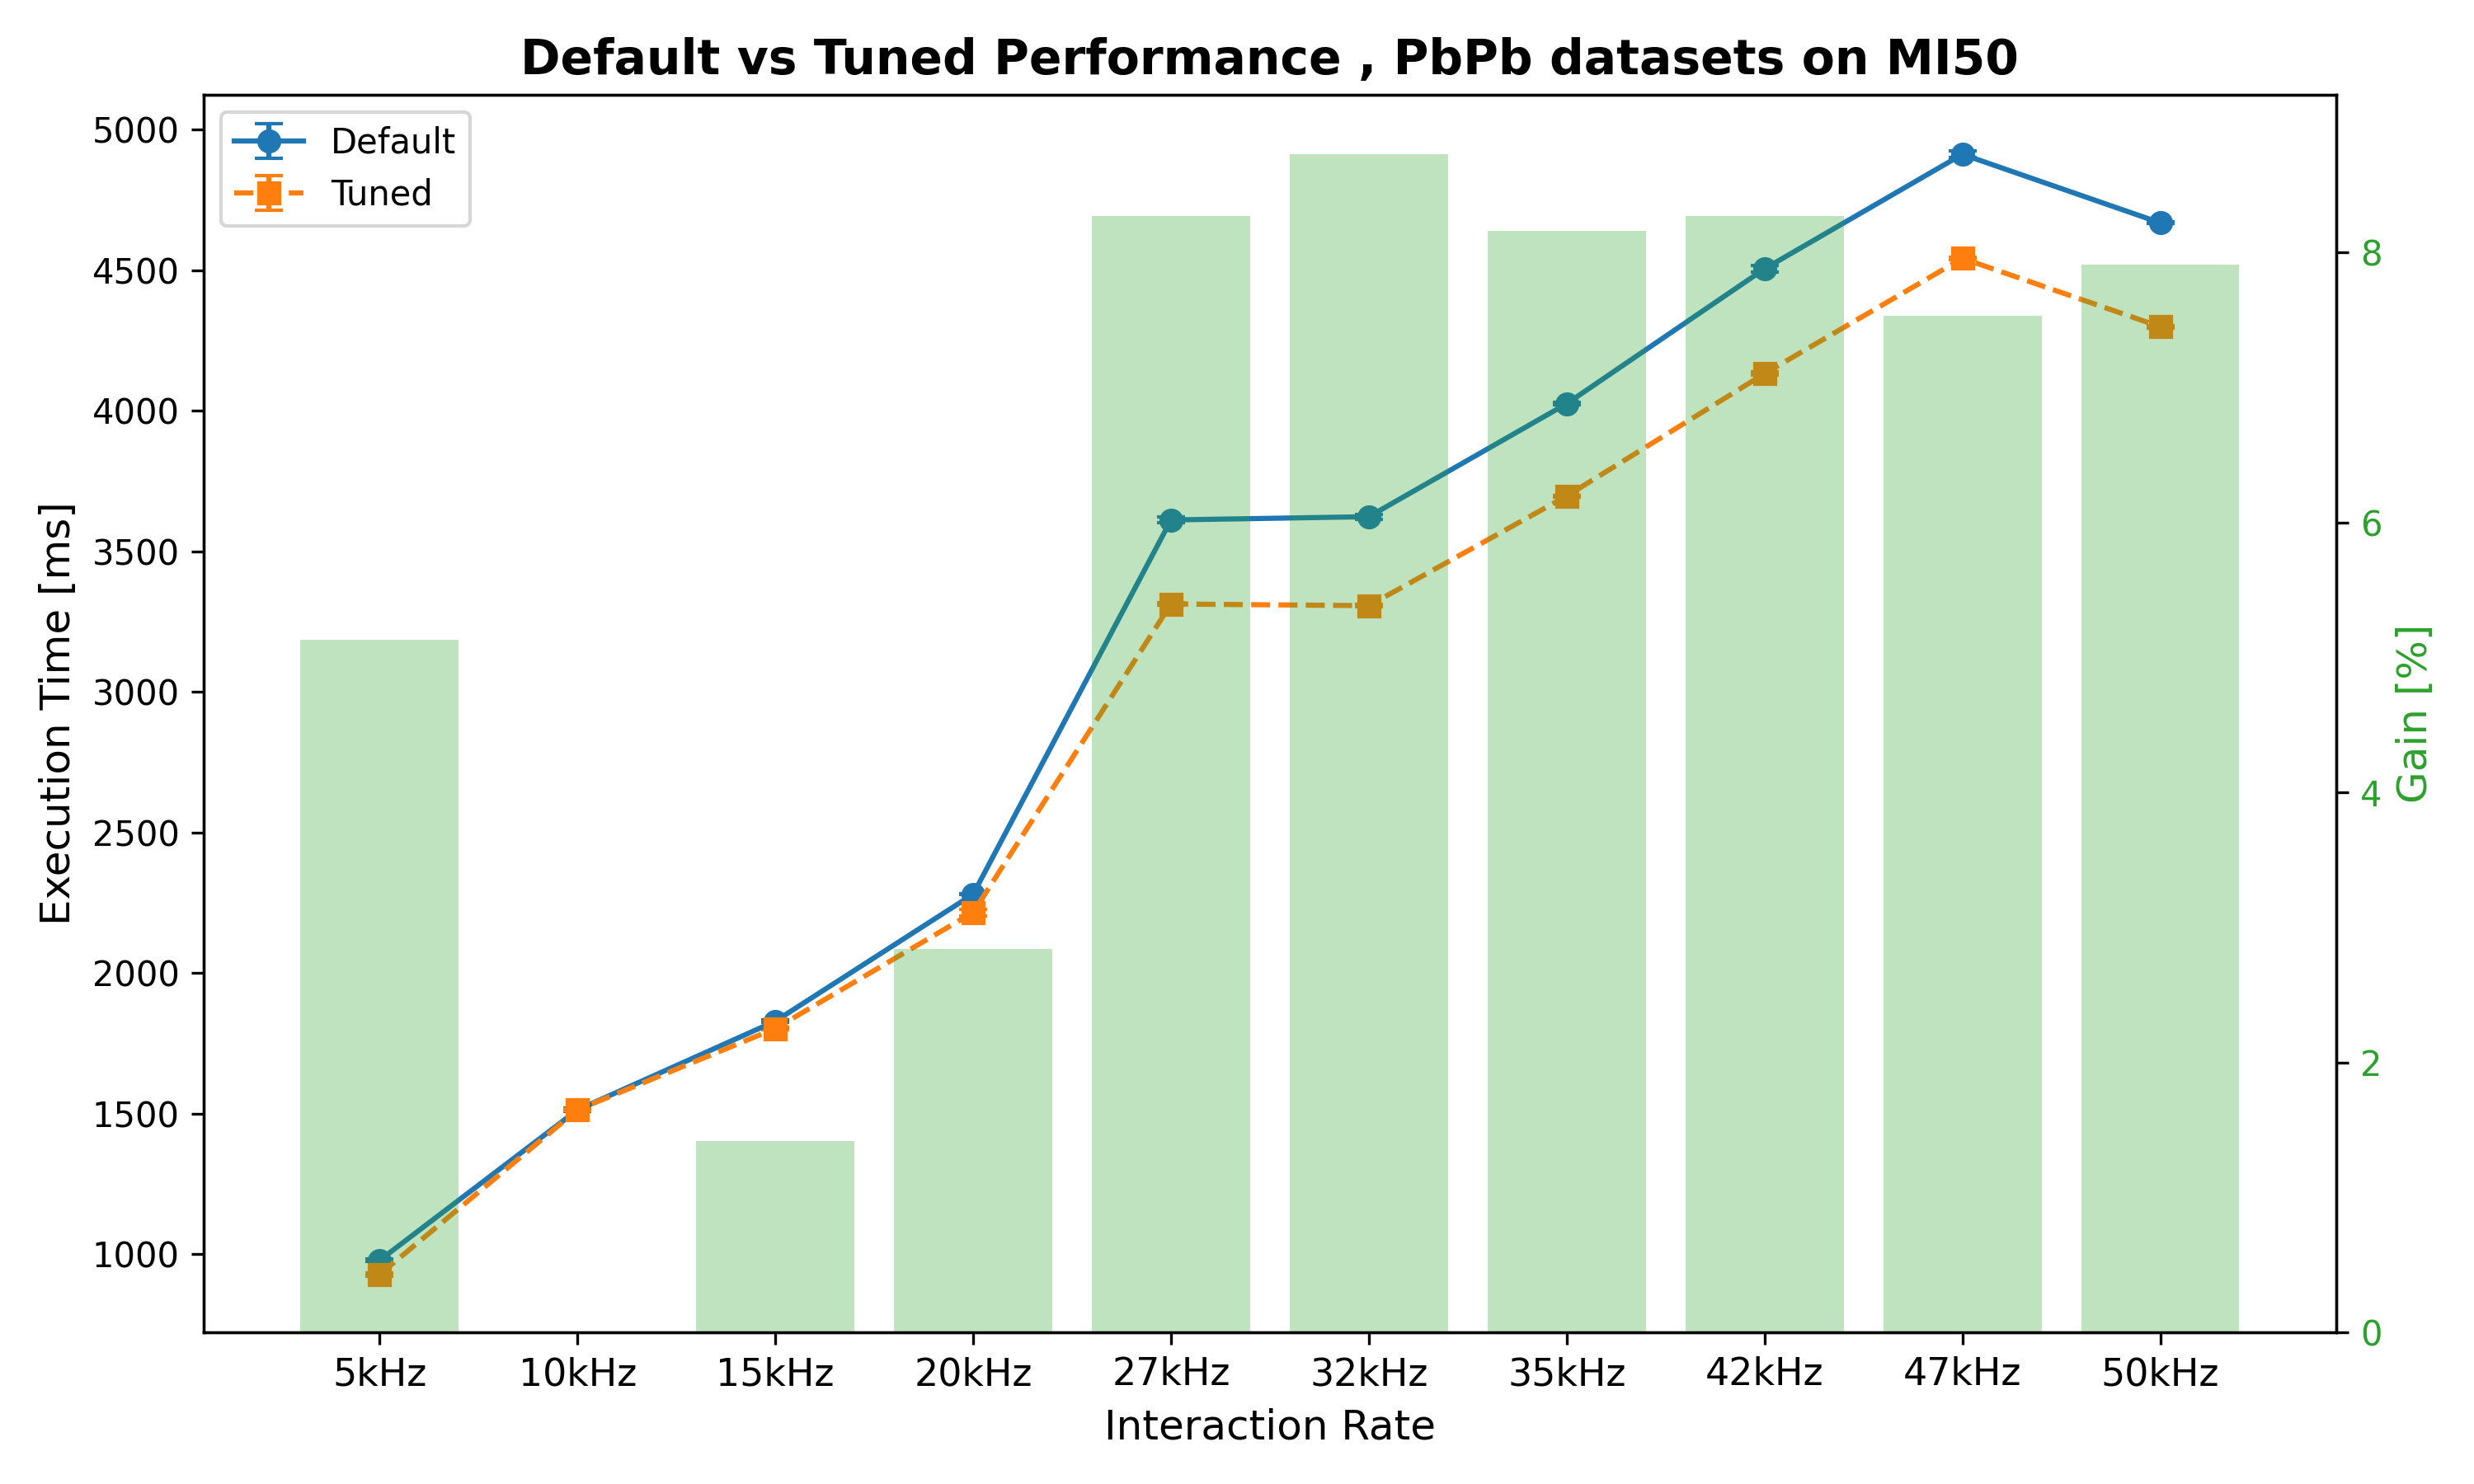
| Interaction Rate | Default mean time [ms] | Tuned time [ms] | Gain |
| 5kHz | 978.91 ms ± 5.20 ms | 928.67 ms ± 6.25 ms | 5.13% |
| 10kHz | 1513.75 ms ± 5.65 ms | 1514.12 ms ± 3.63 ms | -0.02% |
| 15kHz | 1829.28 ms ± 3.76 ms | 1803.34 ms ± 3.37 ms | 1.42% |
| 20kHz | 2281.01 ms ± 0.93 ms | 2216.18 ms ± 12.26 ms | 2.84% |
| 27kHz | 3612.01 ms ± 10.66 ms | 3313.26 ms ± 4.76 ms | 8.27% |
| 32kHz | 3623.72 ms ± 9.07 ms | 3307.26 ms ± 4.69 ms | 8.73% |
| 35kHz | 4025.52 ms ± 4.37 ms | 3697.15 ms ± 3.37 ms | 8.16% |
| 42kHz | 4505.26 ms ± 11.93 ms | 4132.51 ms ± 5.75 ms | 8.27% |
| 47kHz | 4912.68 ms ± 11.40 ms | 4542.61 ms ± 3.48 ms | 7.53% |
| 50kHz | 4668.87 ms ± 3.24 ms | 4299.42 ms ± 4.06 ms | 7.91% |
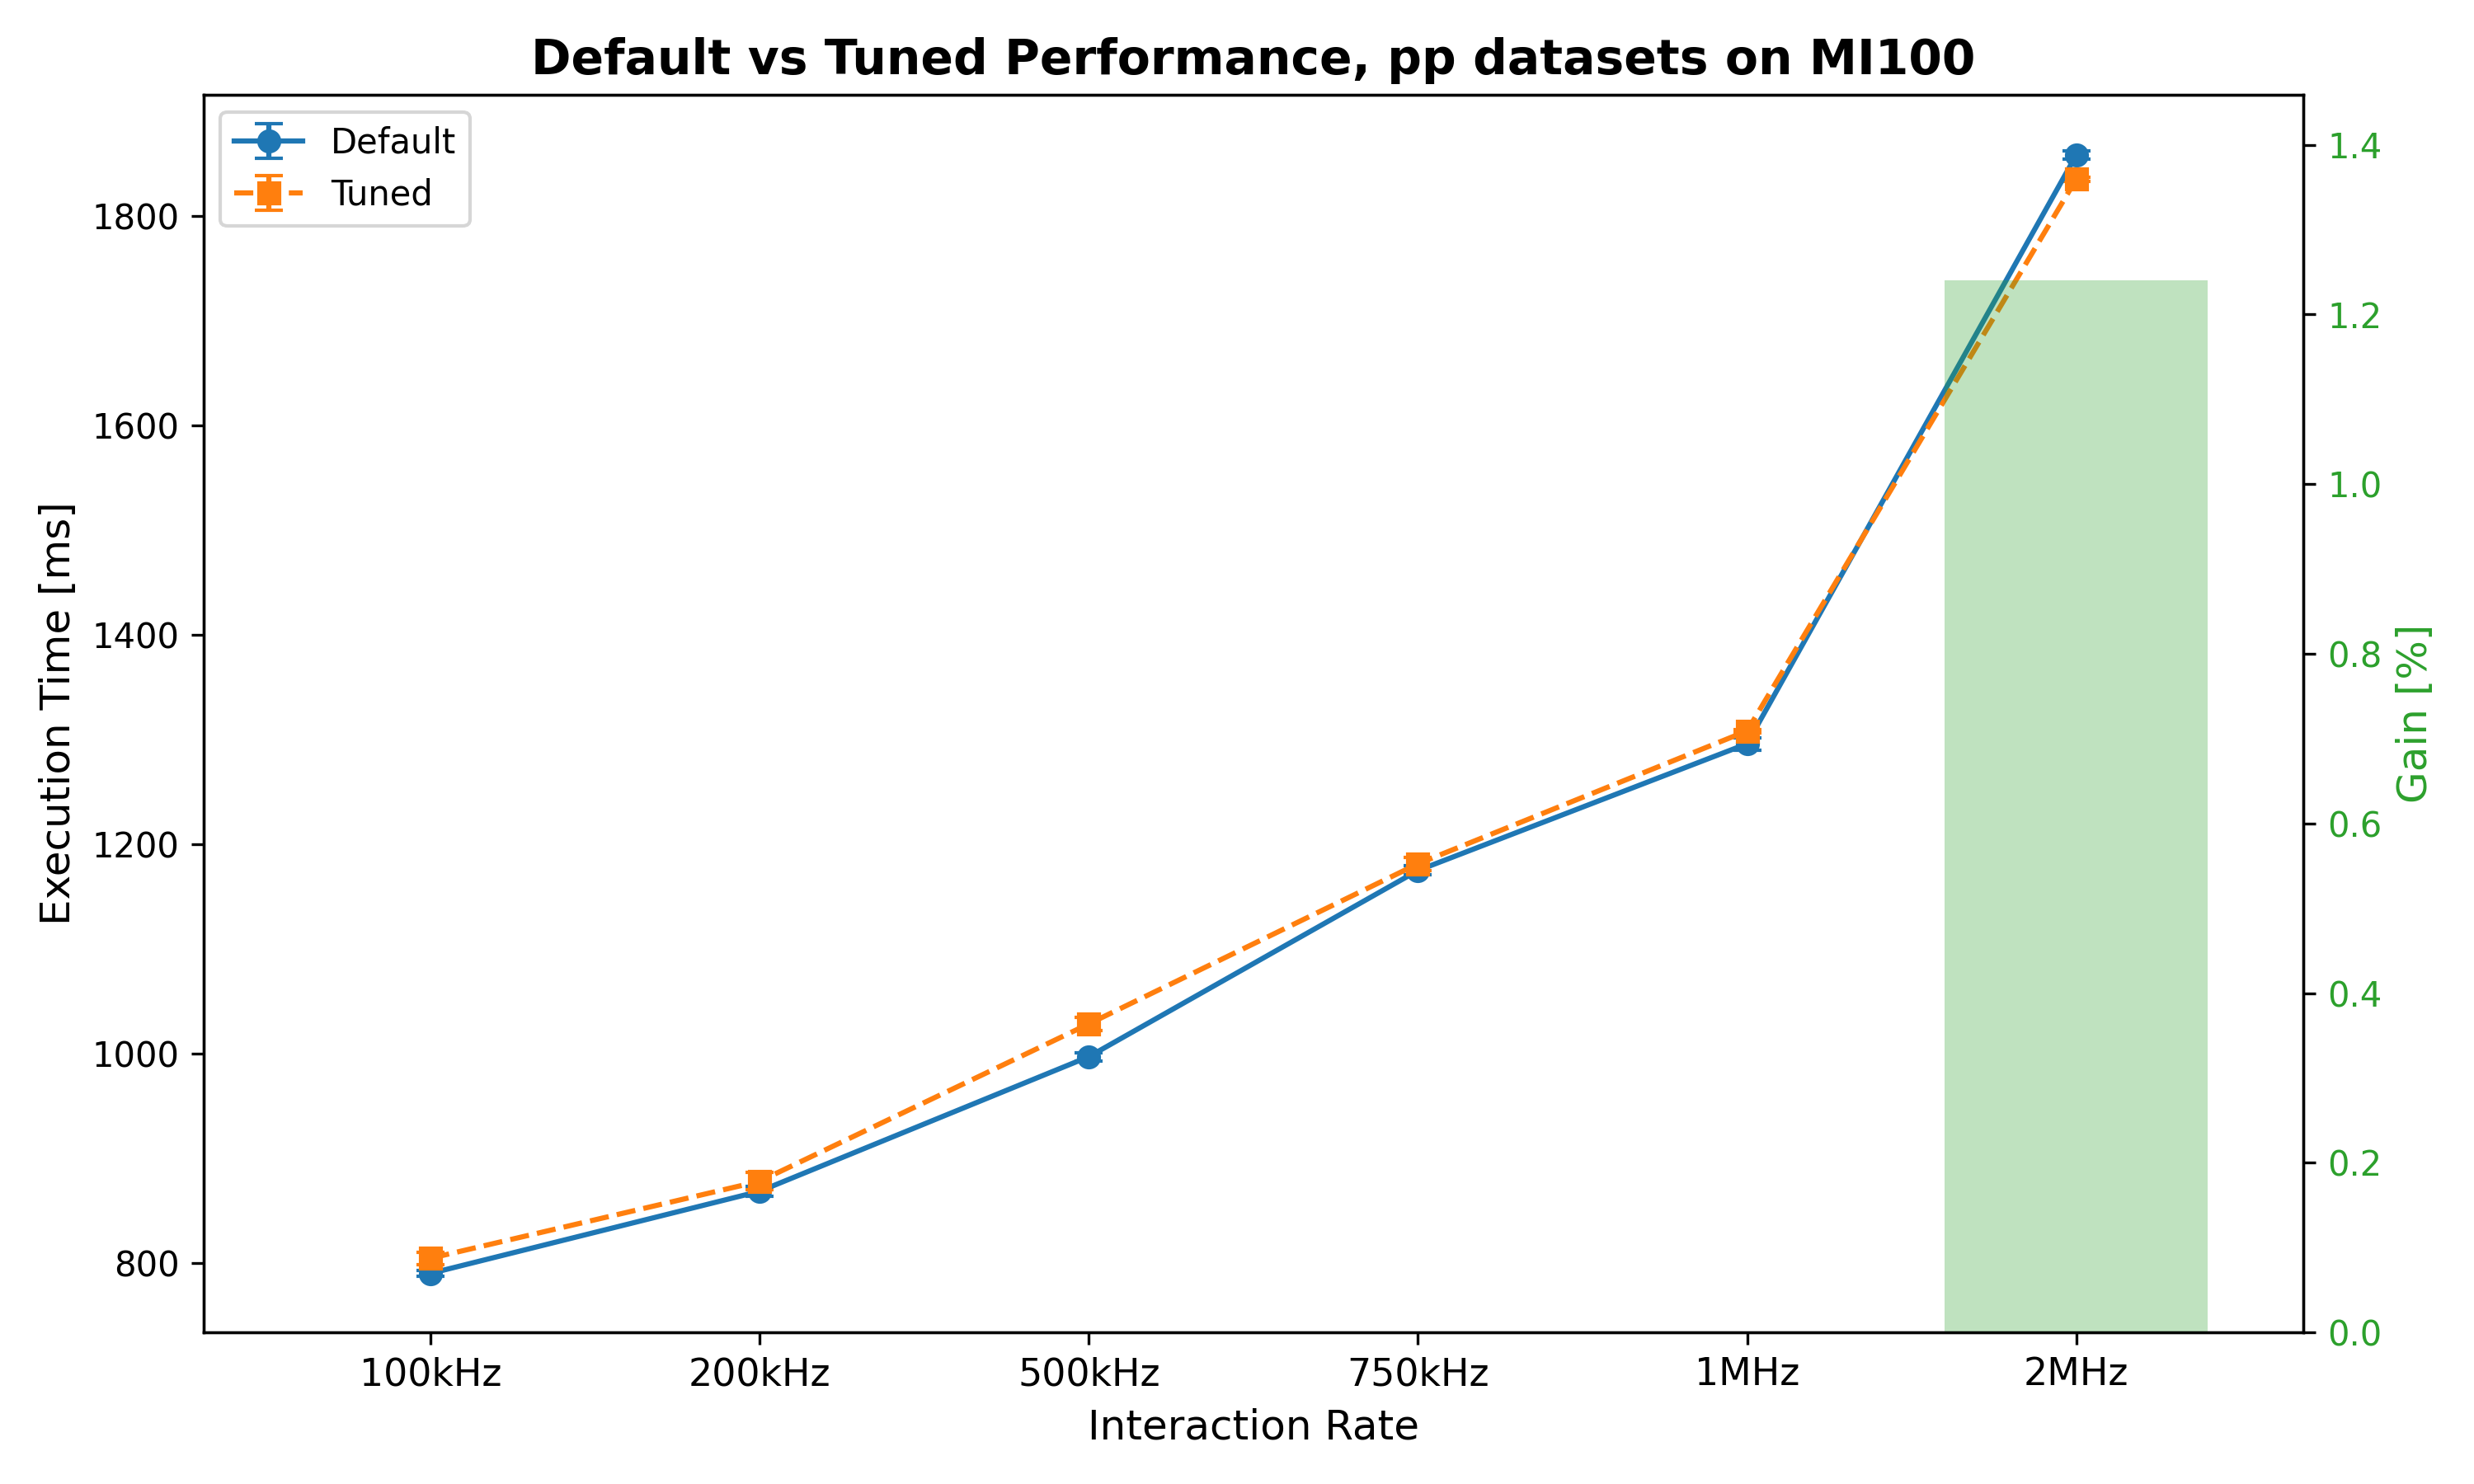
Tuned also on MI100, and tested best parameters for PbPb 50 kHz with other IR and beam types:
| Interaction Rate | Default mean time [ms] | Tuned time [ms] | Gain |
| 100kHz | 790.20 ms ± 2.69 ms | 804.62 ms ± 5.87 ms | -1.82% |
| 200kHz | 868.61 ms ± 4.93 ms | 878.17 ms ± 8.26 ms | -1.10% |
| 500kHz | 997.19 ms ± 3.98 ms | 1028.51 ms ± 6.37 ms | -3.14% |
| 750kHz | 1175.06 ms ± 4.23 ms | 1181.46 ms ± 6.34 ms | -0.54% |
| 1MHz | 1296.13 ms ± 5.85 ms | 1308.41 ms ± 1.59 ms | -0.95% |
| 2MHz | 1858.52 ms ± 3.77 ms | 1835.43 ms ± 2.23 ms | 1.24% |
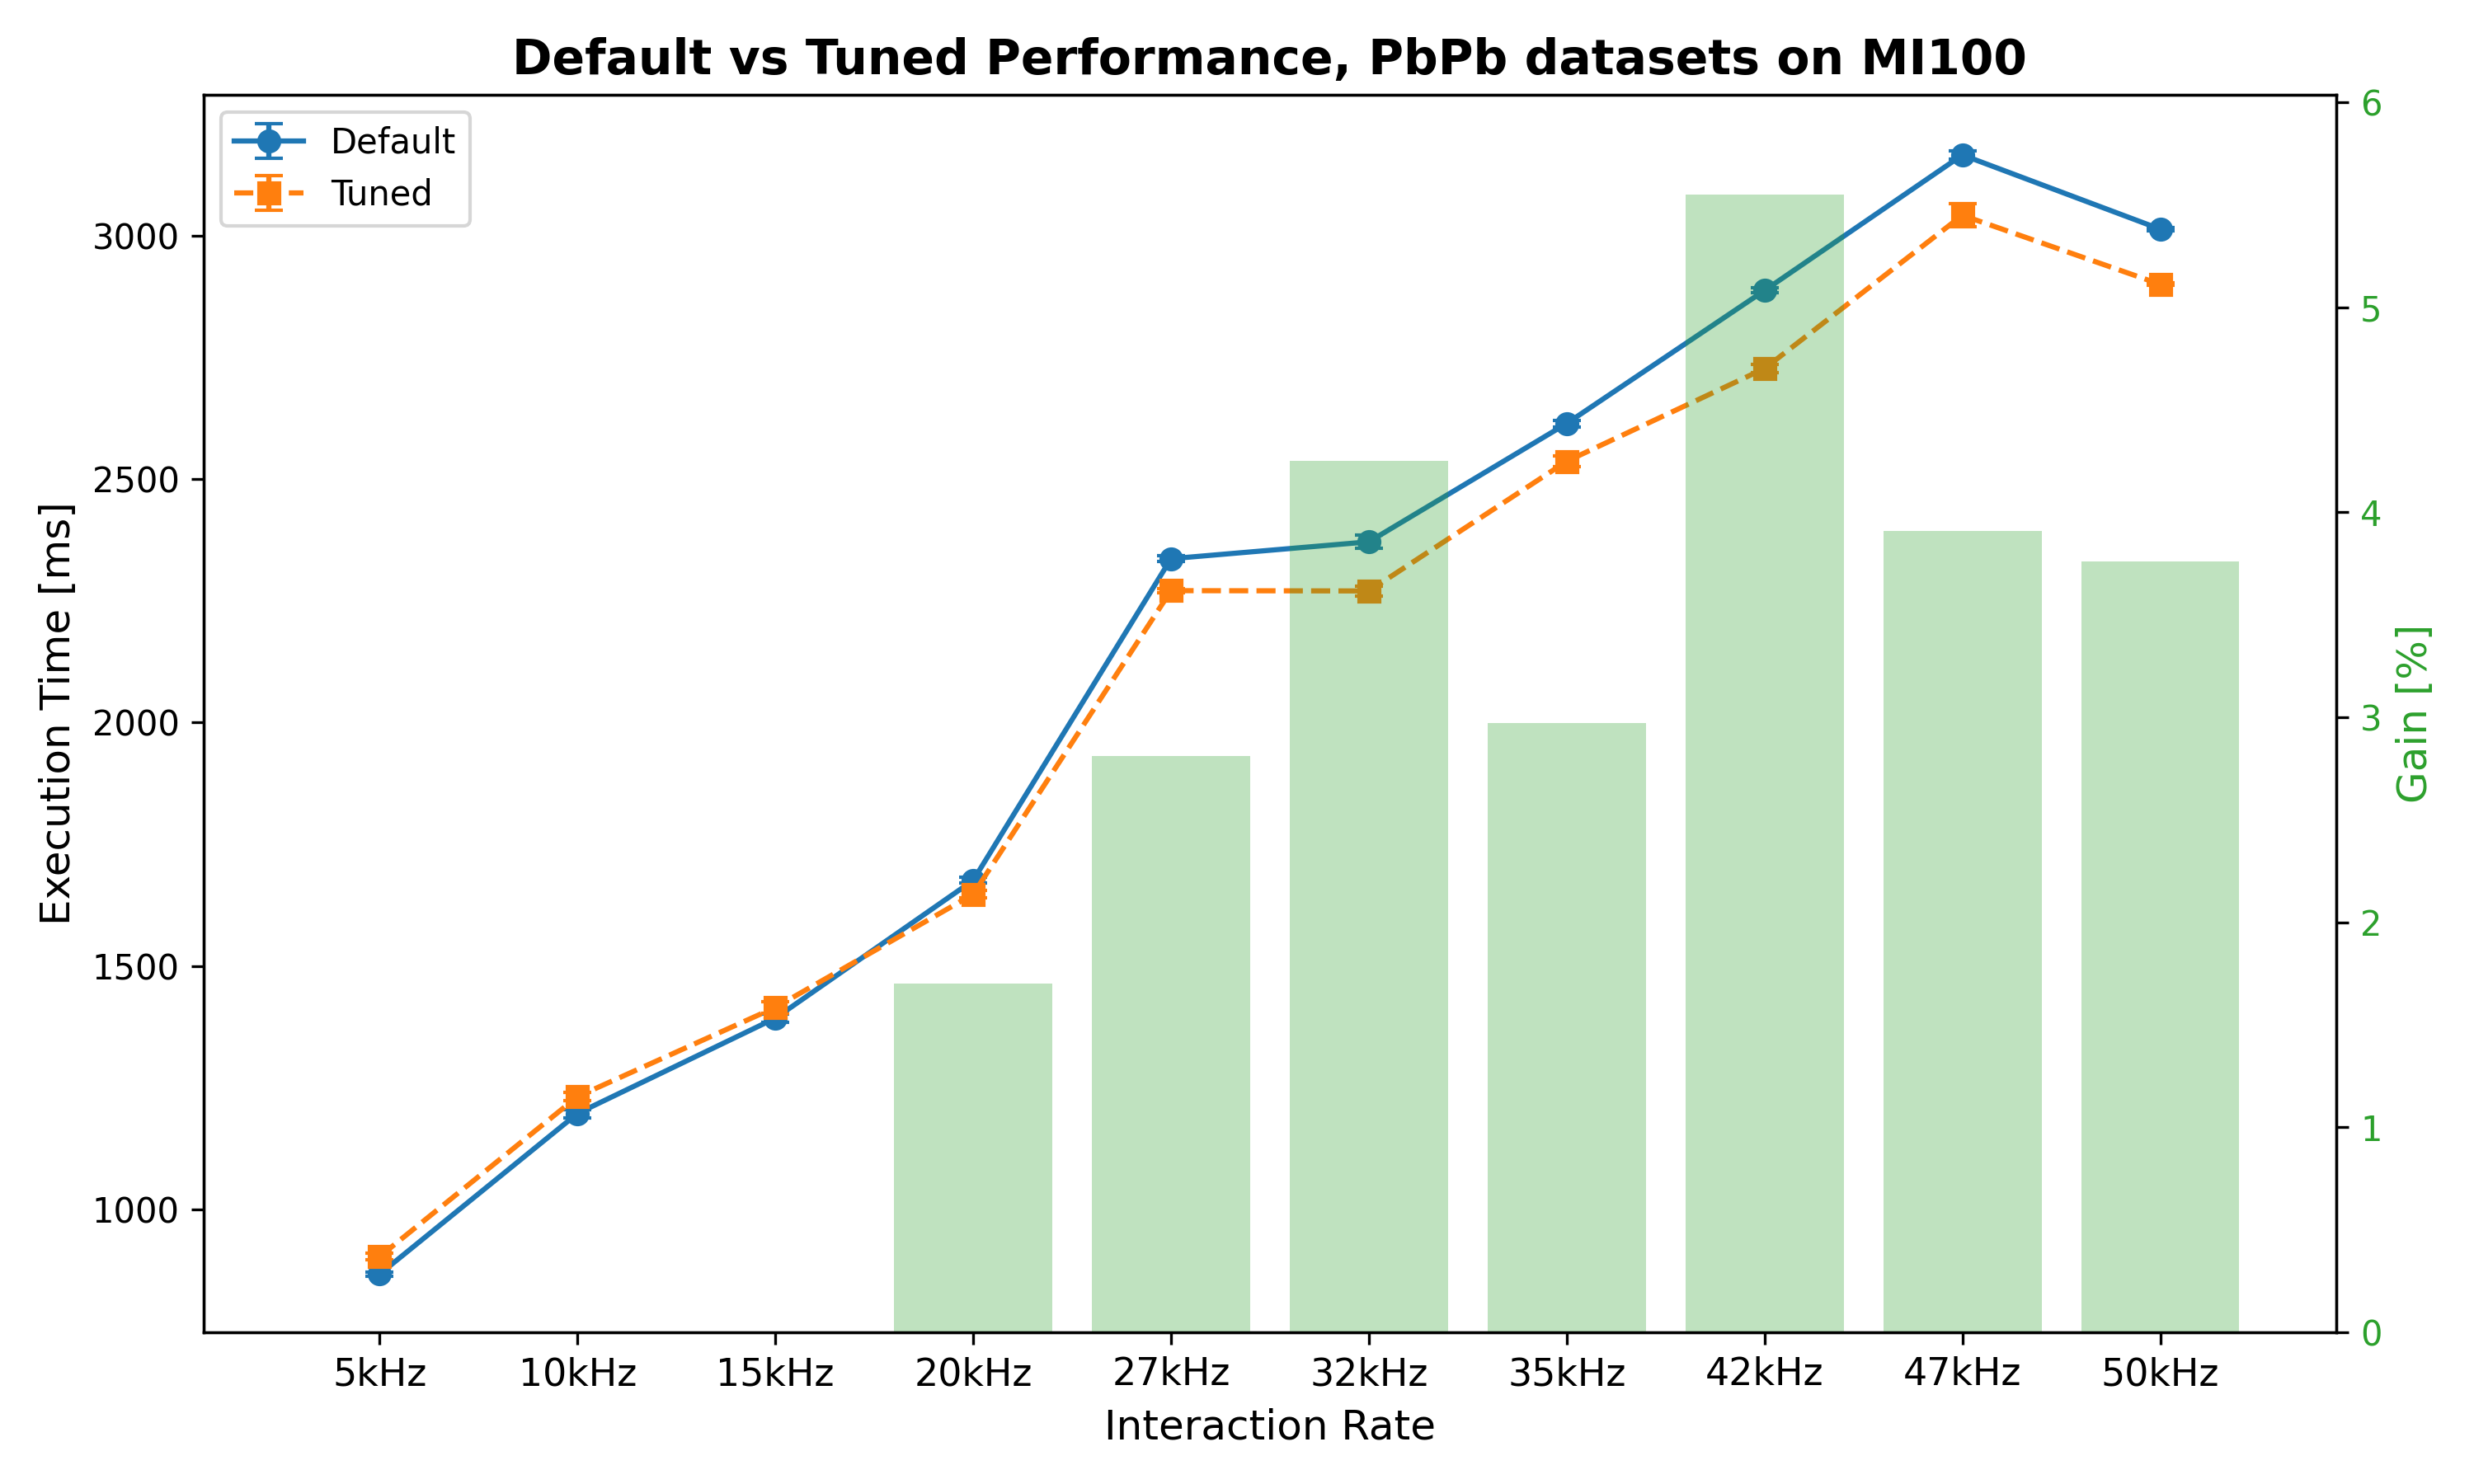
| Interaction Rate | Default mean time [ms] | Tuned time [ms] | Gain |
| 5kHz | 867.53 ms ± 4.21 ms | 903.62 ms ± 6.35 ms | -4.16% |
| 10kHz | 1197.34 ms ± 8.60 ms | 1231.92 ms ± 8.03 ms | -2.89% |
| 15kHz | 1393.01 ms ± 8.96 ms | 1415.13 ms ± 11.16 ms | -1.59% |
| 20kHz | 1675.92 ms ± 5.72 ms | 1647.40 ms ± 7.74 ms | 1.70% |
| 27kHz | 2336.33 ms ± 5.64 ms | 2270.74 ms ± 4.78 ms | 2.81% |
| 32kHz | 2370.99 ms ± 13.98 ms | 2270.10 ms ± 10.50 ms | 4.25% |
| 35kHz | 2613.92 ms ± 6.63 ms | 2536.30 ms ± 10.28 ms | 2.97% |
| 42kHz | 2886.99 ms ± 4.88 ms | 2726.75 ms ± 8.61 ms | 5.55% |
| 47kHz | 3165.24 ms ± 7.95 ms | 3041.40 ms ± 23.87 ms | 3.91% |
| 50kHz | 3012.92 ms ± 3.81 ms | 2899.64 ms ± 2.33 ms | 3.76% |
https://its.cern.ch/jira/browse/O2-6264
Test 1: ITS GPU tracking
General problem running pp productions on EPNs (not related to ITS!). Had to switch to test tracking in Pb-Pb so the test below is for 38 kHz (not what I wanted but actually stress test now!)
Two things had to be fixed for this to work properly:
std::bad_alloc however for grid jobs there is a validation script at the end which explicitly regex scan the logs for this and errors the job even if the pipeline/reconstruction is successful, so just mask this exception https://github.com/AliceO2Group/AliceO2/pull/14671 [merged]
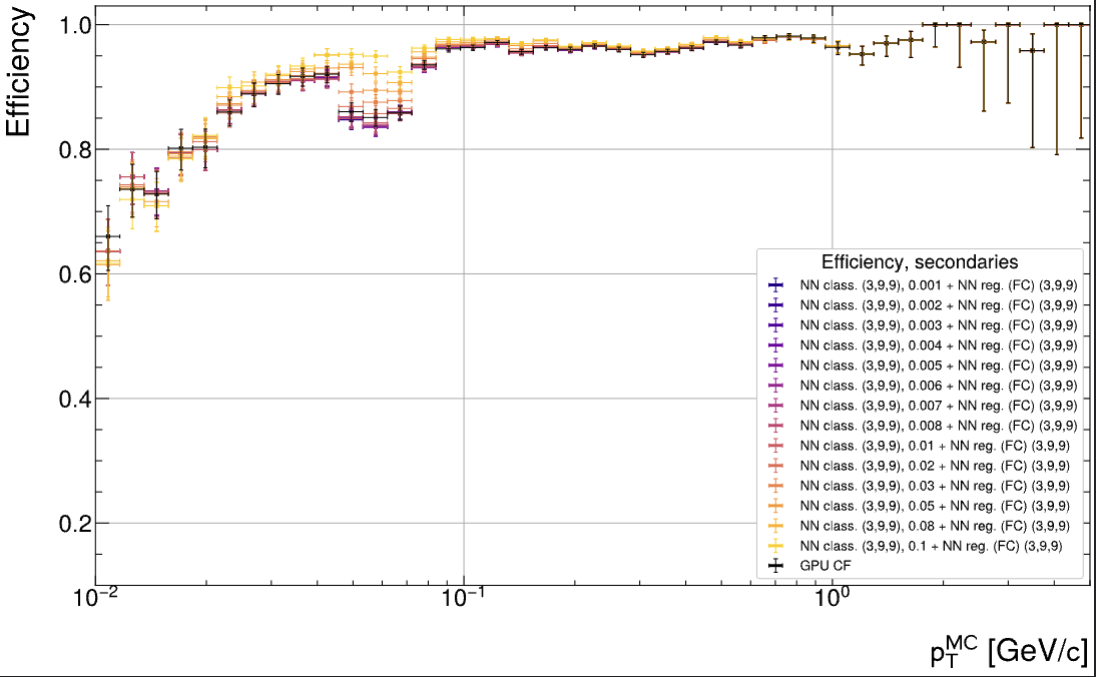
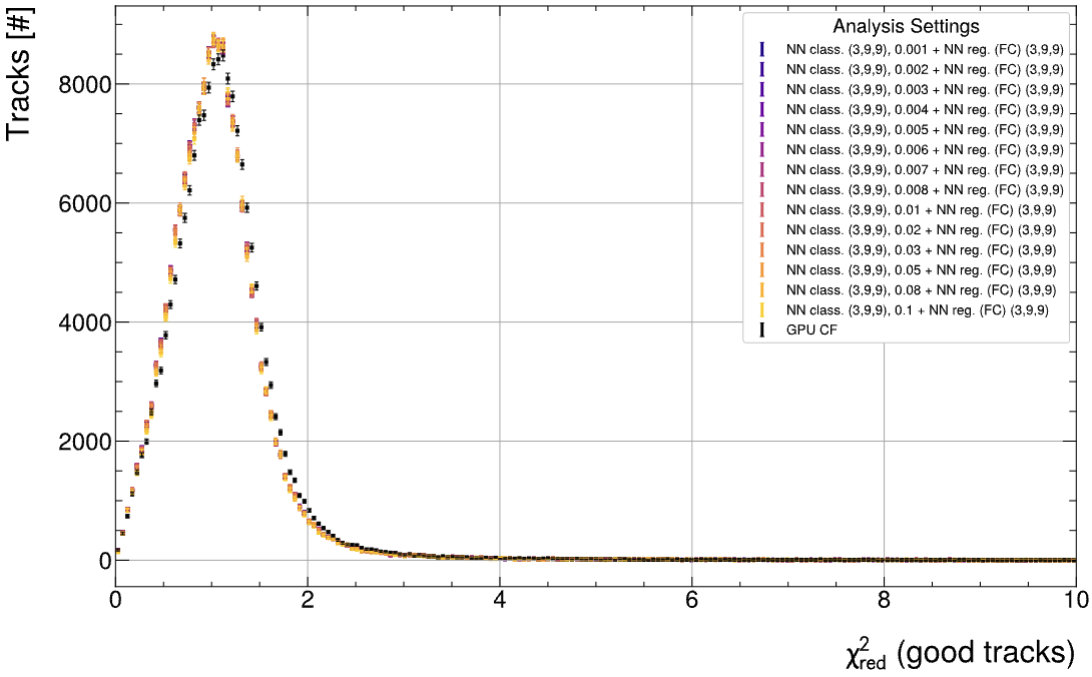
Here from AnalysisQC produced by Igor (thanks!), showing sort of matching efficiency of ITS&TPC against detector occupancy:

Both reconstruction CPU (inverted color)/GPU overlayed, basically looks identical!
Minor differences only at very high occupancy, where lack of statistics (20 minute data chunk) and difference in GPU output becomes visible and enhanced.
But also I think we have to check and compare how many TFs we drop in both (may need to implement deallocation between iterations, GPU memory only wiped after processing the whole TF)!
If we can take the timings on monalisa seriously then the processing of the whole production is 36% faster!
But maybe a more in-depth analysis is needed?
Also merged partial implementation of the GPU seeding vertexing code.