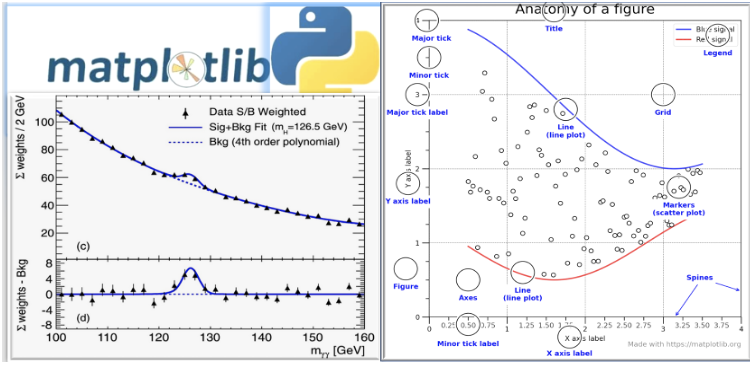
Analyzing and visualizing datasets in plots can help understand them and communicate their meaning to others whether one is doing a lab course or research. Matplotlib is the standard when it comes to making such plots. It comprises of a comprehensive library for creating static, animated, and interactive visualizations using Python. This tutorial gives students a hands-on experience of versatility and functionality of Matplotlib to produce plots. It will provide explanations and demonstration of interactive examples and enable students to use this knowledge in their future projects. This outreach software training event is part of "IRIS-HEP Training and Outreach" program
This event was done in two parts 5 March and 19 March 2022
Conference information
Registration
Registration for this event is currently open.
